
It’s that time of year again! As our in-house designer, January means that I need to finish collecting data and start designing our chamber’s annual report / infographic. We unveil ours at our yearly dinner and then distribute it online and in new member packets.
For this project I always prefer to collect several examples to look at before I start to outline my own. You can view my collection on Pinterest, but I’ve gone through many of them and bulleted out many of the statistics below. I’ve also included links to infographic templates, and chamber examples in case you need more design inspiration.
On this page:
- links to free templates
- Examples of infographics from chambers of commerce
- Statistics to consider for your annual report
- Share your hard work!
Help making your infographic:
Free infographic templates – each link includes free templates, but there will also be the option for paid, so just be careful what you click on.
Examples of Infographic Layouts
This is not an all-inclusive list, I just wanted to include some infographic examples. There are additional infographics by & for chambers of commerce on my Pinterest Board.
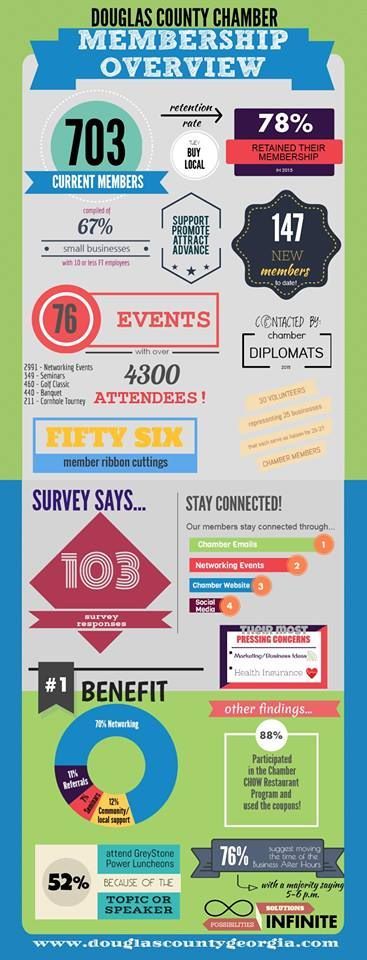
Mixed Chart Infographic
Includes multiple kinds of charts (like pie charts, bar graphs, etc.).
List Infographic
Mostly text based, but might include visual icons.
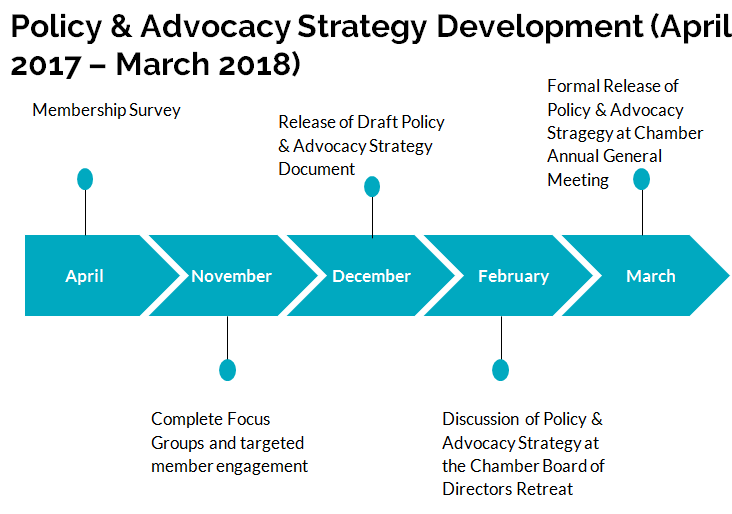
Timeline Infographic
Shows how something changed or occurred over time.
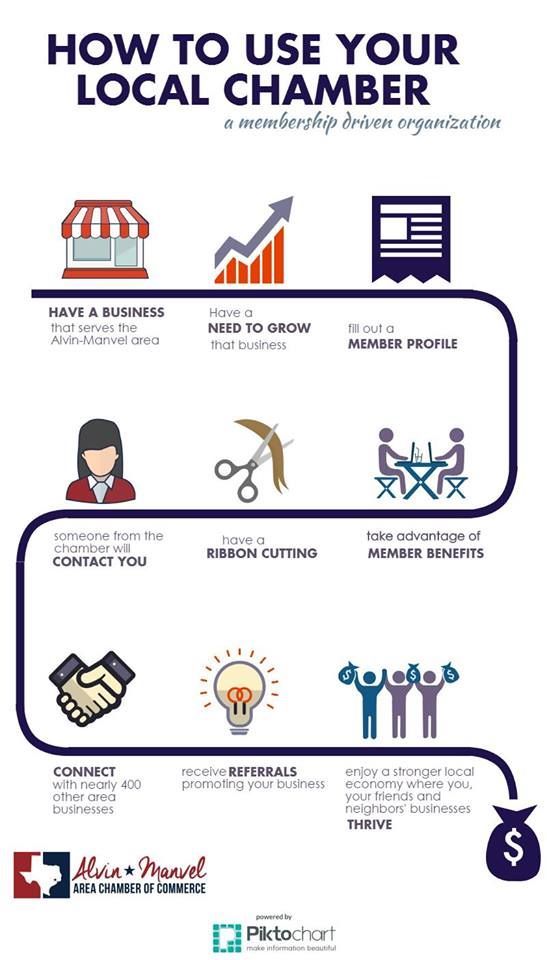
Process Infographic or How-to Guide
Includes step-by-step instructions.
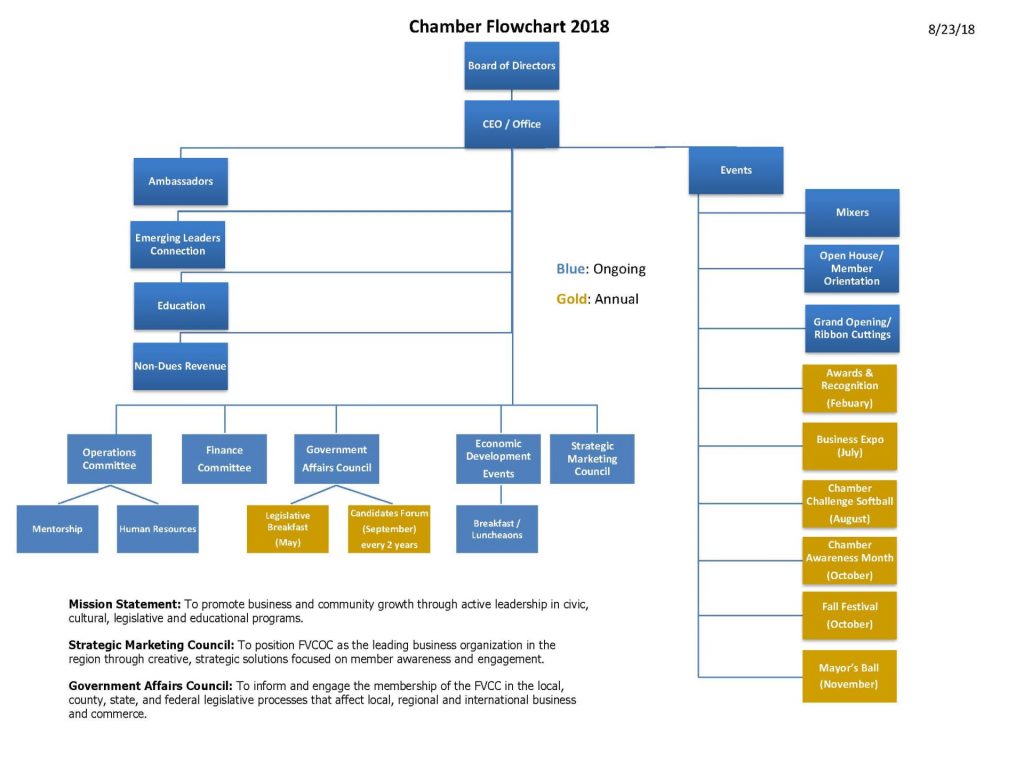
Flowchart Infographic
Starts a single point and branches off at different sections, to lead you to a specific example or outcome.
Visualized Number Infographic
Adds images to statics and numbers so the information is more attractive.
Visualized Article
Breaks down a lengthy bit of text into more visual sections.
From the web: Do’s and Don’ts of Infographics
Examples of statistics you might include in your Annual Report
I’ve gone through a ton of chamber infographics and developed a list of stats that they’ve used:
Basic information about your organization
- # years serving the community
- Age of city
- # of Staff
- # Cumulative years of experience
- # committees
- # volunteers
- # initiatives/programs/projects
- Membership impact on small businesses (% from Schapiro Report)
- # visitors, walk-ins, phone calls
- Visitors from # different states
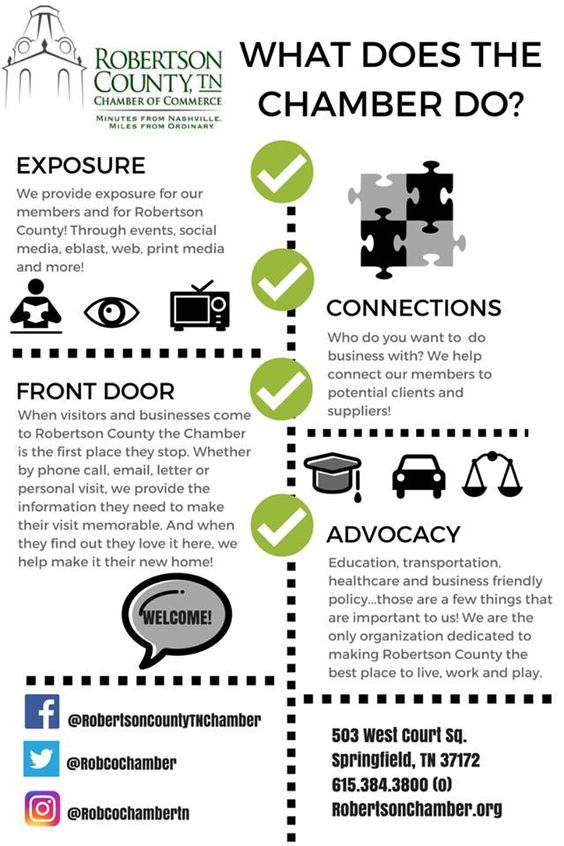
Advocacy
- # positions taken on state bills
- % success rate in blocking anti-Business Legislation
- Represented members at # city/county council meetings
- # candidate forums held to educate community
- # Industries/Businesses Represented
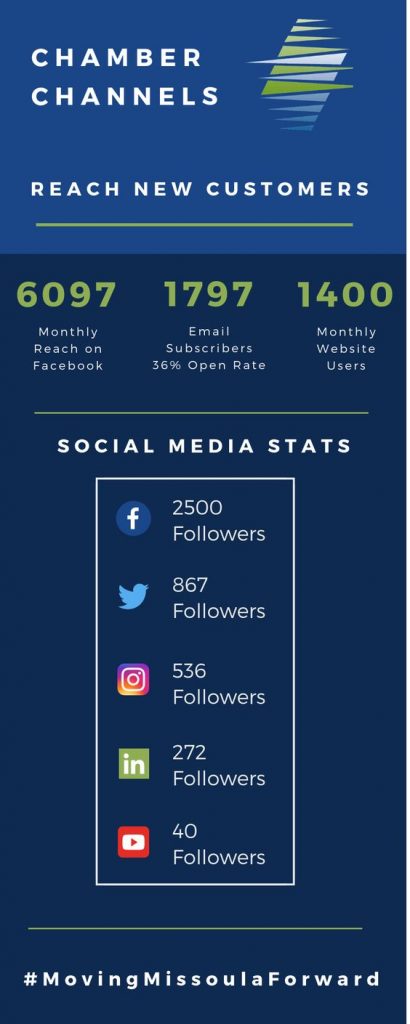
Website Statistics
Note: I’m mostly including vanity metrics. I point this out because I give different information to our board members, supervisors, coworkers, etc. The statics you give them should relate back to your business objectives.
- # online member referrals
- Directory/Event/Job/Deal searches or page views
- Member Page Views
Communications
- % Email open rate
- # Email subscribers
- # sent emails opened
- # [publications] distributed
- # RFPs sent
- # internet/print/broadcast impressions
Social Media stats
- # of social media platforms (that the chamber uses to help promote your business)
- # Reach or reach per post
- # Followers
- % follower growth
- # Engagements
- # Facebook Event Reach
Membership
- # members strong
- # employees represented
- Can section out civic or nonprofits
- # of New Members
- Member Growth as a %
- Member Retention %
- Pie chart – membership demographics
- example: 63% of our members have 5 employees or less
Recommended: Measuring Membership Engagement
Events
- # of Events
- Free vs paid
- Section out key events, like ribbon cuttings, networking, etc.
- Ranked by most attended
- # of Sponsors
- # of Volunteers
- # of Event Attendees
- # Graduates, Leaders, Teams, Tickets sold, etc.
- # Industries/Businesses Represented
- $ Economic Impact for [location]
- # [demographic] [verb] [event]
- Ex: 25 students received scholarships
- Ex: 300 seniors interested in leads at expo
- Ex: 5 super heroes honored at awards
- Ex: 100 consultations hosted for new businesses
- Sold Out # Tickets
- # Nominations Received
- $ secured in scholarships, other program
- Partnered with [group] to bring # people to [event or program]
City & Economic
- demographics
- income – per job, house
- Average cost of housing/utilities
- # new business started every [day/etc.]
- Tax structure
- # colleges, students
- Cost of living
- # construction permits
- % job growth or unemployment rate
Tourism
- Economic impact
- # flights
- # passengers
- # visitors
- # cities/countries represented
- % change
- Average cost of Rentals/room rate
- Retail sales
- Tax revenue generated / Accommodations tax collected
- $ spent per person
- # airport arrivals
- Occupancy rates
- Tourism employees # people in [location]
- Without tourism, each [location] would pa $ more in taxes
Qualitative content
Don’t forget to brag! Feel free to include:
- Awards you’ve received
- A testimonial
- City named x
- Ex: Little River listed in Top 10 Places to Retire in SC
- a good survey response
- Recent accomplishments
- Re-investments/Projects
- Qualitative communication reports
- Top business category searches on the chamber website
- Benefit(s) of membership, especially harder to promote ones such as voice of business
- List key events/programs
- Qualitative outcomes of any of the above
- Established X, which X
- Instituted X to X
- Co-chaired X, which X
- Conducted X that X
- Mission statement – if you need to take up space (personal choice)
- Top employers, industries in the area
- Tell a story to explain how you solve a problem
- Top member type/industry
Share your infographic!
You’ve worked hard on your report, so share it proudly! Places to use it:
- Printed on or with your program at your annual dinner meeting or Gala
- Share on social media
- Create a blog post
- In your email newsletter (link to your blog post, otherwise a social media post)
- Keep copies in your office to show potential members
- In new member welcome packets
More Infographics by other Chambers
Please follow me on Pinterest for more chamber ideas:

No Comments